Building an AI-powered Power Plant - Part 2
Introduction
In a previous post, we introduced our small solar power plant.
We can consume the energy it produces, store it in a battery, or sell it to the grid. We developed a simple scheduler that let us preset when to charge the battery, and when to use or sell the energy from it.
The downside of such approach was that users still had to figure out the best settings by themselves.
If we wanted to make their life easier, we needed to make it more autonomous.
In the following sections, we’ll discuss how we adapted to this evolved understanding of the problem, we’ll introduce our optimization method, and we’ll explain how we predict variables going into the it. Next, we’ll present our rudimentary UI, and show how it all works together.
Defining the Problem
New learnings
Last time, we mentioned that electricity spot prices can sometimes be negative. That is bad if you are selling electricity, but good if you are buying it. It might even make sense to buy and waste the energy, since you get paid for it.
This turned out to be more complicated. If you are selling for a spot price, you receive the spot price minus a fee to the grid operator. If you are buying, you pay the spot price plus several fees. Even if the spot price is negative, the final buying price never is. It can be in theory, but we have not seen any such situation in historical data.
Other than that, our assumptions laid our in the previous post seem to hold.
Optimization
Let’s first discuss the underlying optimization problem. This will give us an idea about what input data we need, and what the implementation should look like.
We can use three switches to control the power plant:
supply_to_grid- whether we are preferring selling generated electricity over charging the batterycharge_from_grid- whether we are charging the battery from the gridallow_selling_to_grid- whether the system is allowed to sell excess electricity to the grid
The switches are mapped to parameters of the power plant’s API.
Our goal is to decide when each switch should be on.
The allow_selling_to_grid switch is true if the selling price is positive.
When the selling price is negative or zero, it ensures that we are rather dumping the excess energy than selling it for a loss.
We can express a cost function using the above variables, buying and selling prices, consumption, and solar power production. Then, we impose constraints on the variables, e.g., that we cannot charge battery to more than its maximum capacity. Summing costs for all periods will give us the total cost. We want to minimize it.
Once we express the problem formally, we can plug it into a linear solver.
We opted for Google OR-Tools, as they are well-known and documented. Also, we wrote the previous scheduler in Python, and OR-Tools have a Python API. So, it was easy to integrate.
This is the full optimization code:
def optimize(config: OptimizationConfig) -> OptimizationResult:
    solver = pywraplp.Solver.CreateSolver("SCIP")
    allow_selling_to_grid = [
        1 if price > 0 else 0 for price in config.selling_price
    ]  # allow selling energy to grid
    supply_to_grid = []  # supplying energy to grid
    charge_from_grid = []  # charging battery from grid
    ending_battery_level = []
    period_costs = []
    consumed_from_sun = []
    consumed_from_battery_share = []
    consumed_from_battery = []
    consumed_from_grid = []
    dumped_energy = []

    for index in range(config.number_of_periods):
        supply_to_grid.append(solver.IntVar(0, 1, ""))
        charge_from_grid.append(solver.IntVar(0, 1, ""))
        dumped_energy.append(solver.NumVar(0, config.max_battery_level, ""))
        consumed_from_battery_share.append(solver.NumVar(0, 1, ""))

        consumed_from_sun_per_period = min(
            config.consumption[index], config.sun_energy[index]
        )
        consumed_from_sun.append(consumed_from_sun_per_period)
        consumed_not_from_sun_per_period = max(
            config.consumption[index] - consumed_from_sun_per_period, 0
        )

        consumed_from_battery_per_period = (
            consumed_not_from_sun_per_period * consumed_from_battery_share[index]
        )
        consumed_from_battery.append(consumed_from_battery_per_period)
        consumed_from_grid_per_period = consumed_not_from_sun_per_period * (
            1 - consumed_from_battery_share[index]
        )
        consumed_from_grid.append(consumed_from_grid_per_period)

        # constraints
        solver.Add(
            supply_to_grid[index] + charge_from_grid[index] <= 1
        )  # cannot supply and charge at the same time
        solver.Add(
            supply_to_grid[index] + (1 - allow_selling_to_grid[index]) <= 1
        )  # cannot supply and dump energy at the same time

        previous_battery_level = previous_value(
            index, ending_battery_level, default=config.initial_battery_level
        )
        remaining_solar_energy_per_period = config.sun_charging_efficiency * (
            config.sun_energy[index] - consumed_from_sun_per_period
        )
        ending_battery_level.append(
            previous_battery_level
            - consumed_from_battery_per_period
            + config.sun_charging_efficiency
            * remaining_solar_energy_per_period
            * (1 - supply_to_grid[index])
            * config.sun_charging_efficiency  # charged from sun
            + config.grid_charging_efficiency
            * charge_from_grid[index]
            * config.max_grid_charge_per_period  # charged from grid,
            - dumped_energy[index],
        )
        solver.Add(
            consumed_from_battery_per_period
            <= previous_battery_level - config.min_battery_level
        )  # we cannot consume more than we have - minimum battery level

        solver.Add(
            ending_battery_level[index] <= config.max_battery_level
        )  # battery level cannot be above max

        solver.Add(
            ending_battery_level[index] >= config.min_battery_level
        )  # battery level cannot be below min

        # period_costs
        period_costs.append(
            consumed_from_grid_per_period
            * config.buying_price[index]  # energy consumed from grid (cost)
            + charge_from_grid[index]
            * config.buying_price[index]
            * config.max_grid_charge_per_period  # energy charged from grid (cost)
            - config.selling_price[index]
            * config.supplying_efficiency
            * supply_to_grid[index]
            * remaining_solar_energy_per_period  # energy supplied to grid (revenue)
        )
    # assume that the remaining energy in the battery is sold at the average price
    # (multiplied by -1 because it is a revenue, and we want a cost function)
    remaining_energy_cost = -(
        (ending_battery_level[-1] - config.min_battery_level)
        * config.supplying_efficiency
        * sum(config.selling_price)
        / len(config.selling_price)
    )

    solver.Minimize(solver.Sum(period_costs + [remaining_energy_cost]))

    status = solver.Solve()
    ending_battery_level = [
        EnergyUnit(var.solution_value()) for var in ending_battery_level
    ]
    return OptimizationResult(
        optimum_found=status == pywraplp.Solver.OPTIMAL,
        total_cost=Cost(solver.Objective().Value()),
        supply_to_grid=[
            binary_int_var_to_bool(var.solution_value()) for var in supply_to_grid
        ],
        charge_from_grid=[
            binary_int_var_to_bool(var.solution_value()) for var in charge_from_grid
        ],
        allow_selling_to_grid=[bool(val) for val in allow_selling_to_grid],
        ending_battery_level=ending_battery_level,
        period_costs=[Cost(var.solution_value()) for var in period_costs],
        remaining_energy_cost=Cost(remaining_energy_cost.solution_value()),
        consumed_from_sun=consumed_from_sun,
        consumed_from_battery=[var.solution_value() for var in consumed_from_battery],
        consumed_from_grid=[var.solution_value() for var in consumed_from_grid],
        dumped_energy=[var.solution_value() for var in dumped_energy],
        min_battery_level_reached=min(ending_battery_level),
        max_battery_level_reached=max(ending_battery_level),
    )
The code introduces a few helper variables, but the core logic is what we described above. The charging efficiency multipliers let us account for energy loss during transfers.
When we run it, we get optimal values for switches in upcoming periods. We also get several other metrics:
Configs:
Number of periods: 400
Min battery level: 10.0
Max battery level: 9000.0
Initial battery level: 500.0
Supplying efficiency: 0.9
Sun charging efficiency: 0.8
Grid charging efficiency: 0.9
--------------------
Results:
Remaining energy cost: -2976.749999992534
Min battery level reached: 35.999999999897
Max battery level reached: 581.0
Total cost: -884326.7500000005
Optimum found: True
Of course, these results are from dummy inputs. Getting a cost of -884,326 EUR, i.e. a profit of 884,326 EUR would be quite nice. At our power plant’s scale, we are working with tens of EUR per day at most.
Data for Optimization
Power plant production data
I ranted about how user-unfriendly the power plant API is the previous post. Let me also say something positive about it. The API has a documented public part for fetching monitoring data. It returns JSON with, e.g., current production, and battery state of charge. We’ll collect those to feed our optimization algorithm.
Electricity prices
The market regulator announces electricity prices in advance. We’ll optimize only for the time when we know the prices. Trying to predict prices for longer period would likely bring only marginal improvement. And it would be a lot more work. (Due to the battery capacity, it almost never makes sense to store the energy for more than a day).
Predicting power plant production
There are several APIs that provide estimates of solar panel production. Some are even free(-ish). Outsourcing this problem would definitely be our go-to option if possible. We tested a few APIs, but their predictions were way off. Integrating a third-party solution that is imprecise did not seem like the best choice. Paying a lot of money for a commercial solution does not align with our idea of a hobby project. Hence, we had to build our own.
I have skimmed several papers on topics like predicting solar panel production and sunlight intensity. None of them seemed to be a good fit for our problem. They were usually too complex, and were dealing with longer term predictions. Some authors seemed to care more about applying neural networks than finding a practical solution. We need predictions for only a couple of hours in advance. And we want a non-complicated solution, so we can adapt it to our needs.
This led us to a super simple approach. We use a weighted average of the last five days of production to estimate daily production. (Yesterday’s weather is an ok predictor of today’s weather.)
Think of a formula like this:
production[0] = (1/1 * production[-1] + ... + 1/5 * production[-5]) / (1 + ... + 1/5)
Then, we distribute the production over the day using sunlight intensity calculation (see this StackExchange answer). I.e., we basically estimate the sunlight intensity based on geographical location and time of the day.
Off course, we are neglecting many factors such as cloud cover and temperature. Time will tell if the approximation is good enough.
Predicting consumption
When and how much electricity we consume throughout the day is one of the most important inputs. We decided that we will not try to schedule consumption, at least not in this version. Meaning that, we will not launch home appliances at specific times, or recommend users to do so. We only predict what the consumption will be in each period.
The users input estimated total consumption per day. We then spread it throughout the day with heuristic weights. We use two sets of weights–one for weekdays and the other for weekends.
Implementation
User interface
The failure of the scheduler taught us that we need to be more user-friendly. We got there in two ways: (1) we demand very little input from users, and (2) we provide a UI.
The only thing that users need to input is the estimated daily consumption. Furthermore, we will be estimating the consumption in the future, so users won’t even have to do that.
As for the UI, we use several HTML pages.
A form for inputting estimated consumption per day
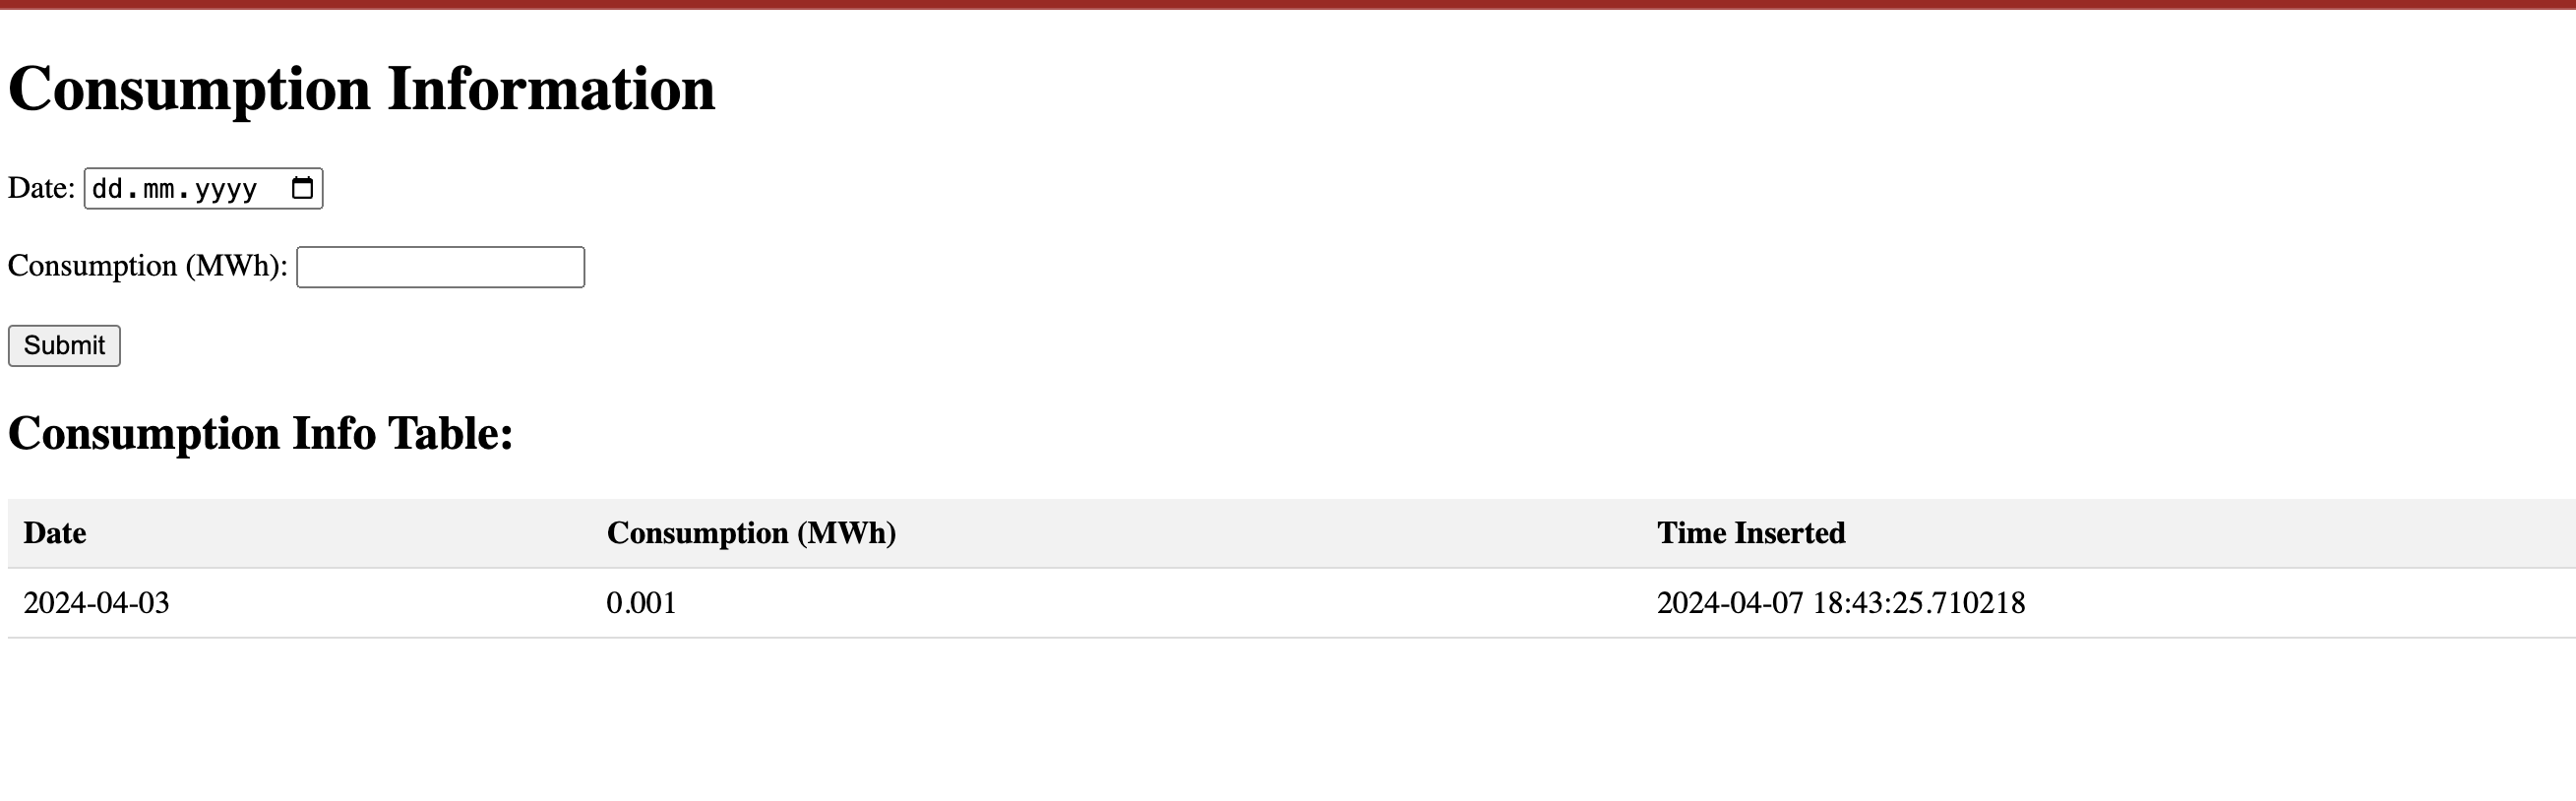
This lets users input the estimated daily consumption.
A form for inputting estimated default consumption
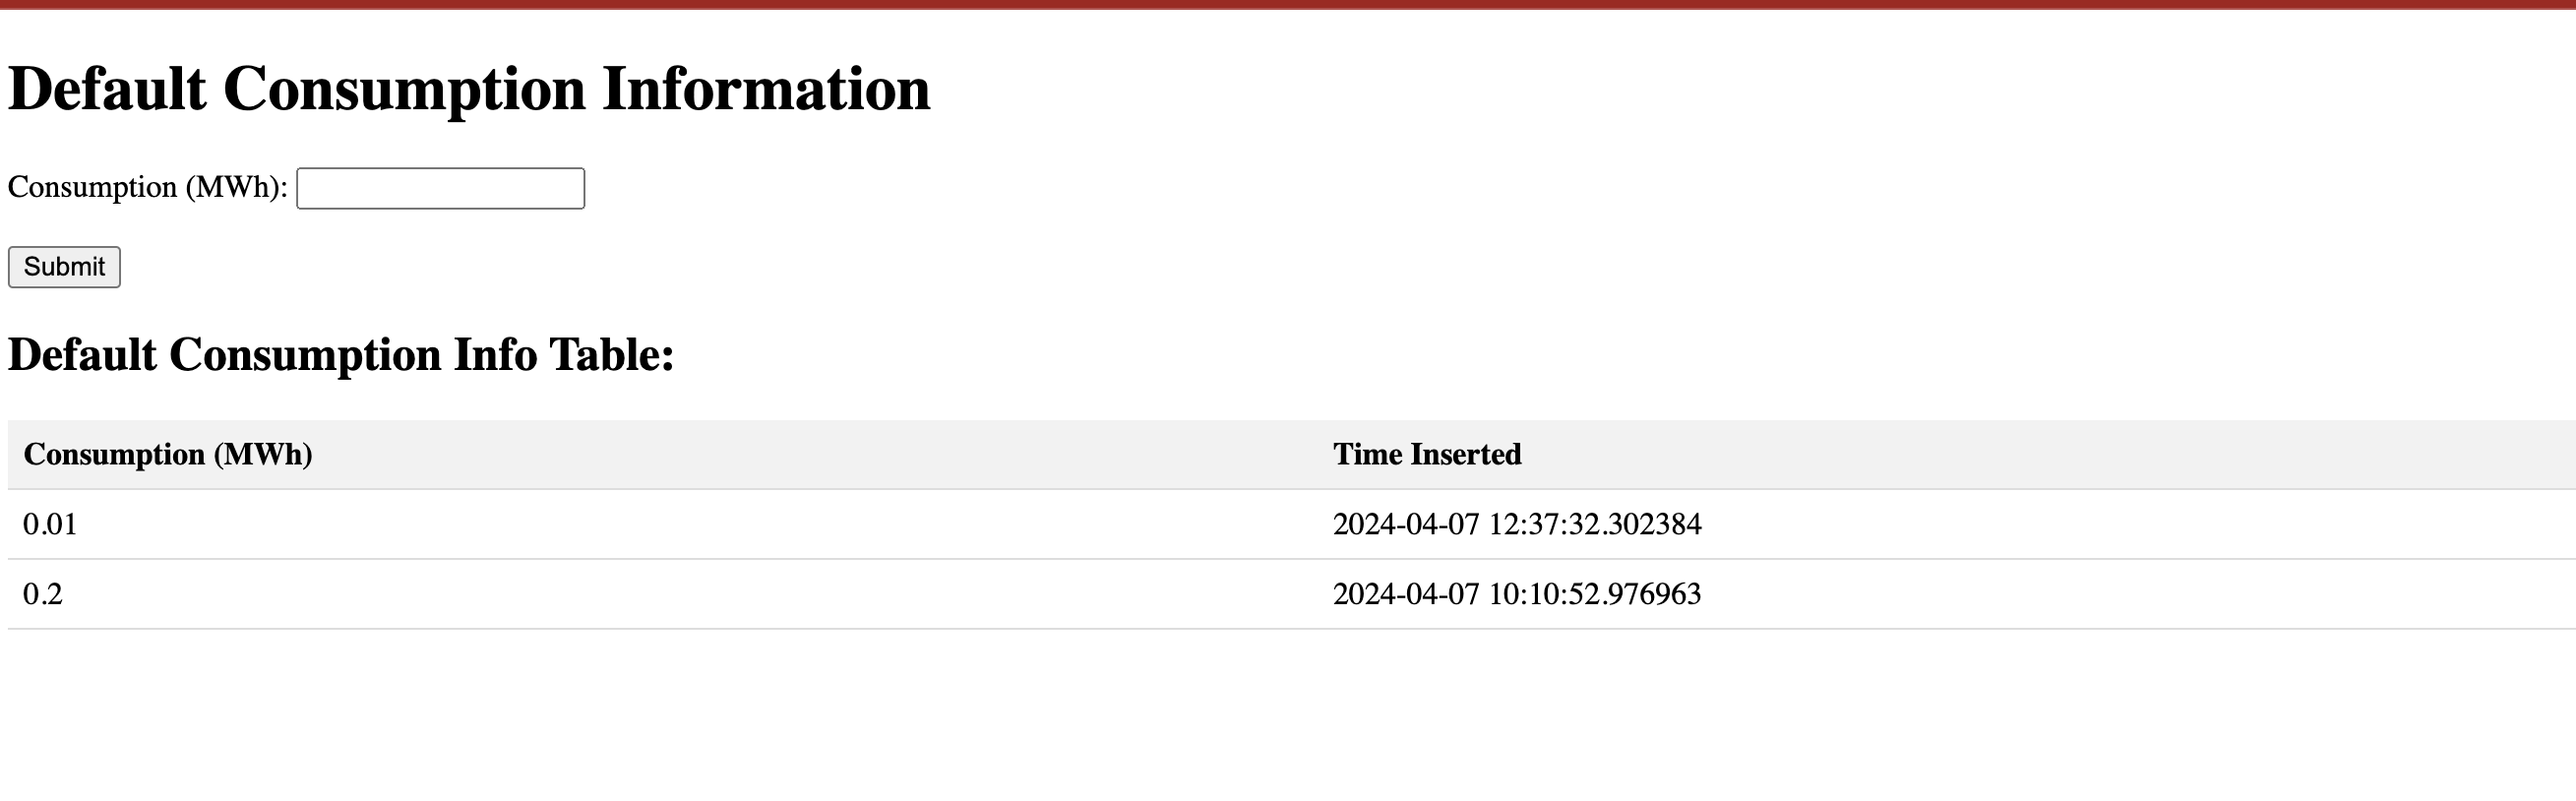
Users can also input estimated default consumption. This gets used when there is no daily-specific consumption.
Additionally, we want to let users see what the optimization suggests. Then, they will be able to point out potential issues.
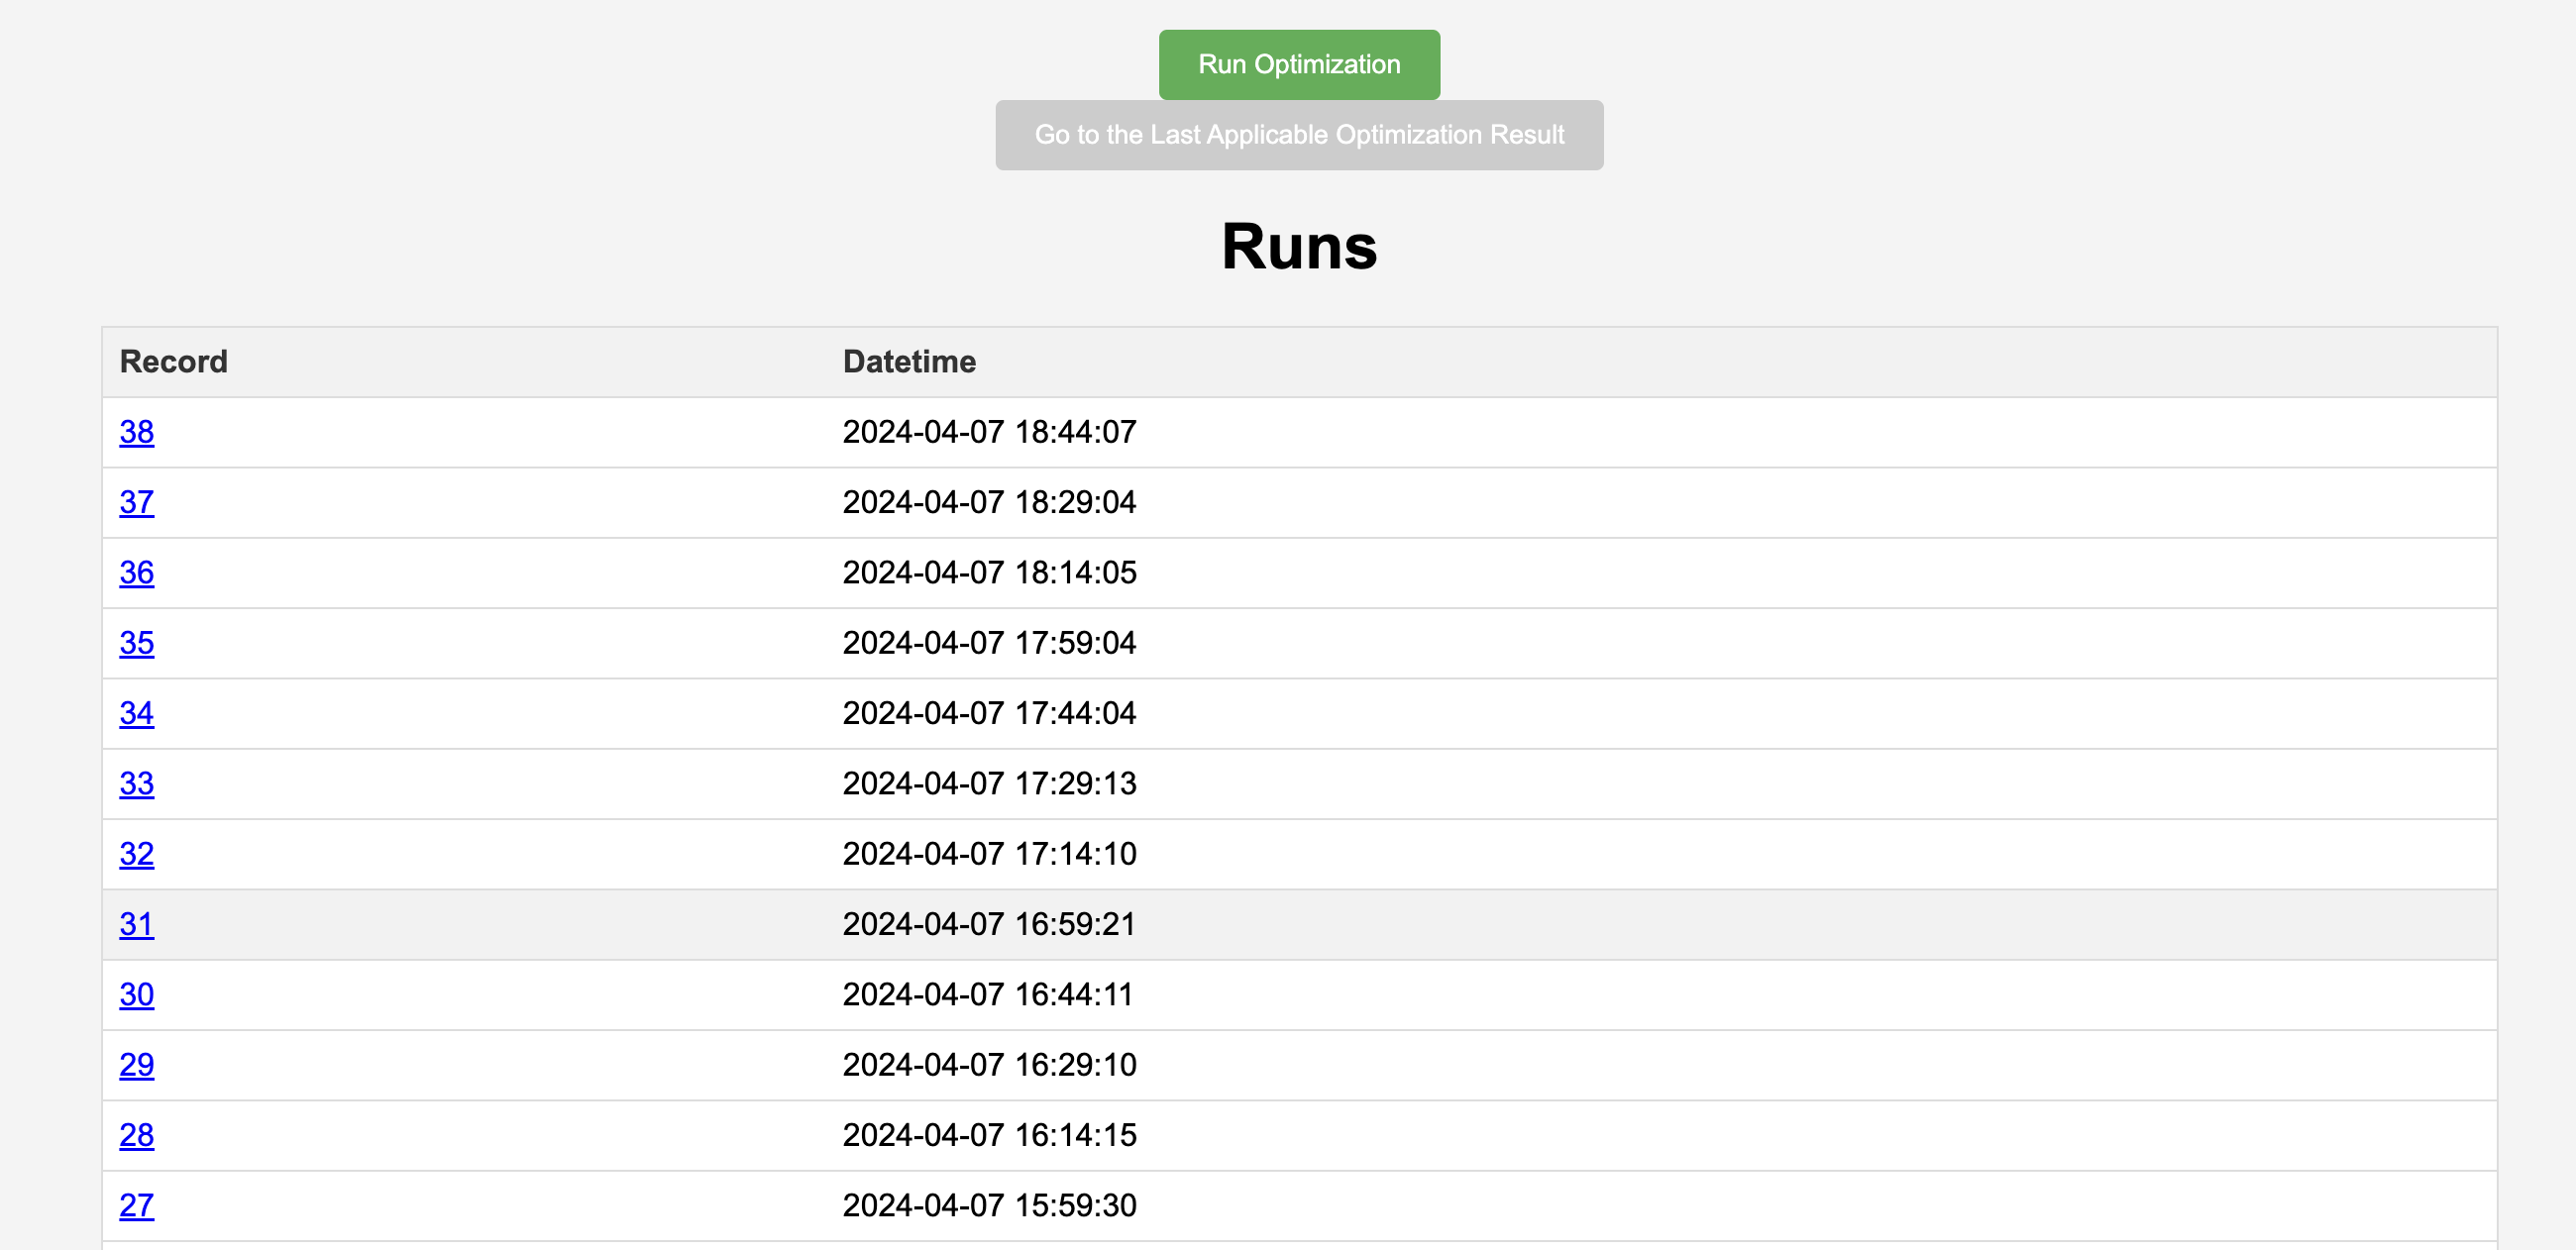
Optimization runs
This page list results of optimization runs. Users can also launch new optimization runs manually.
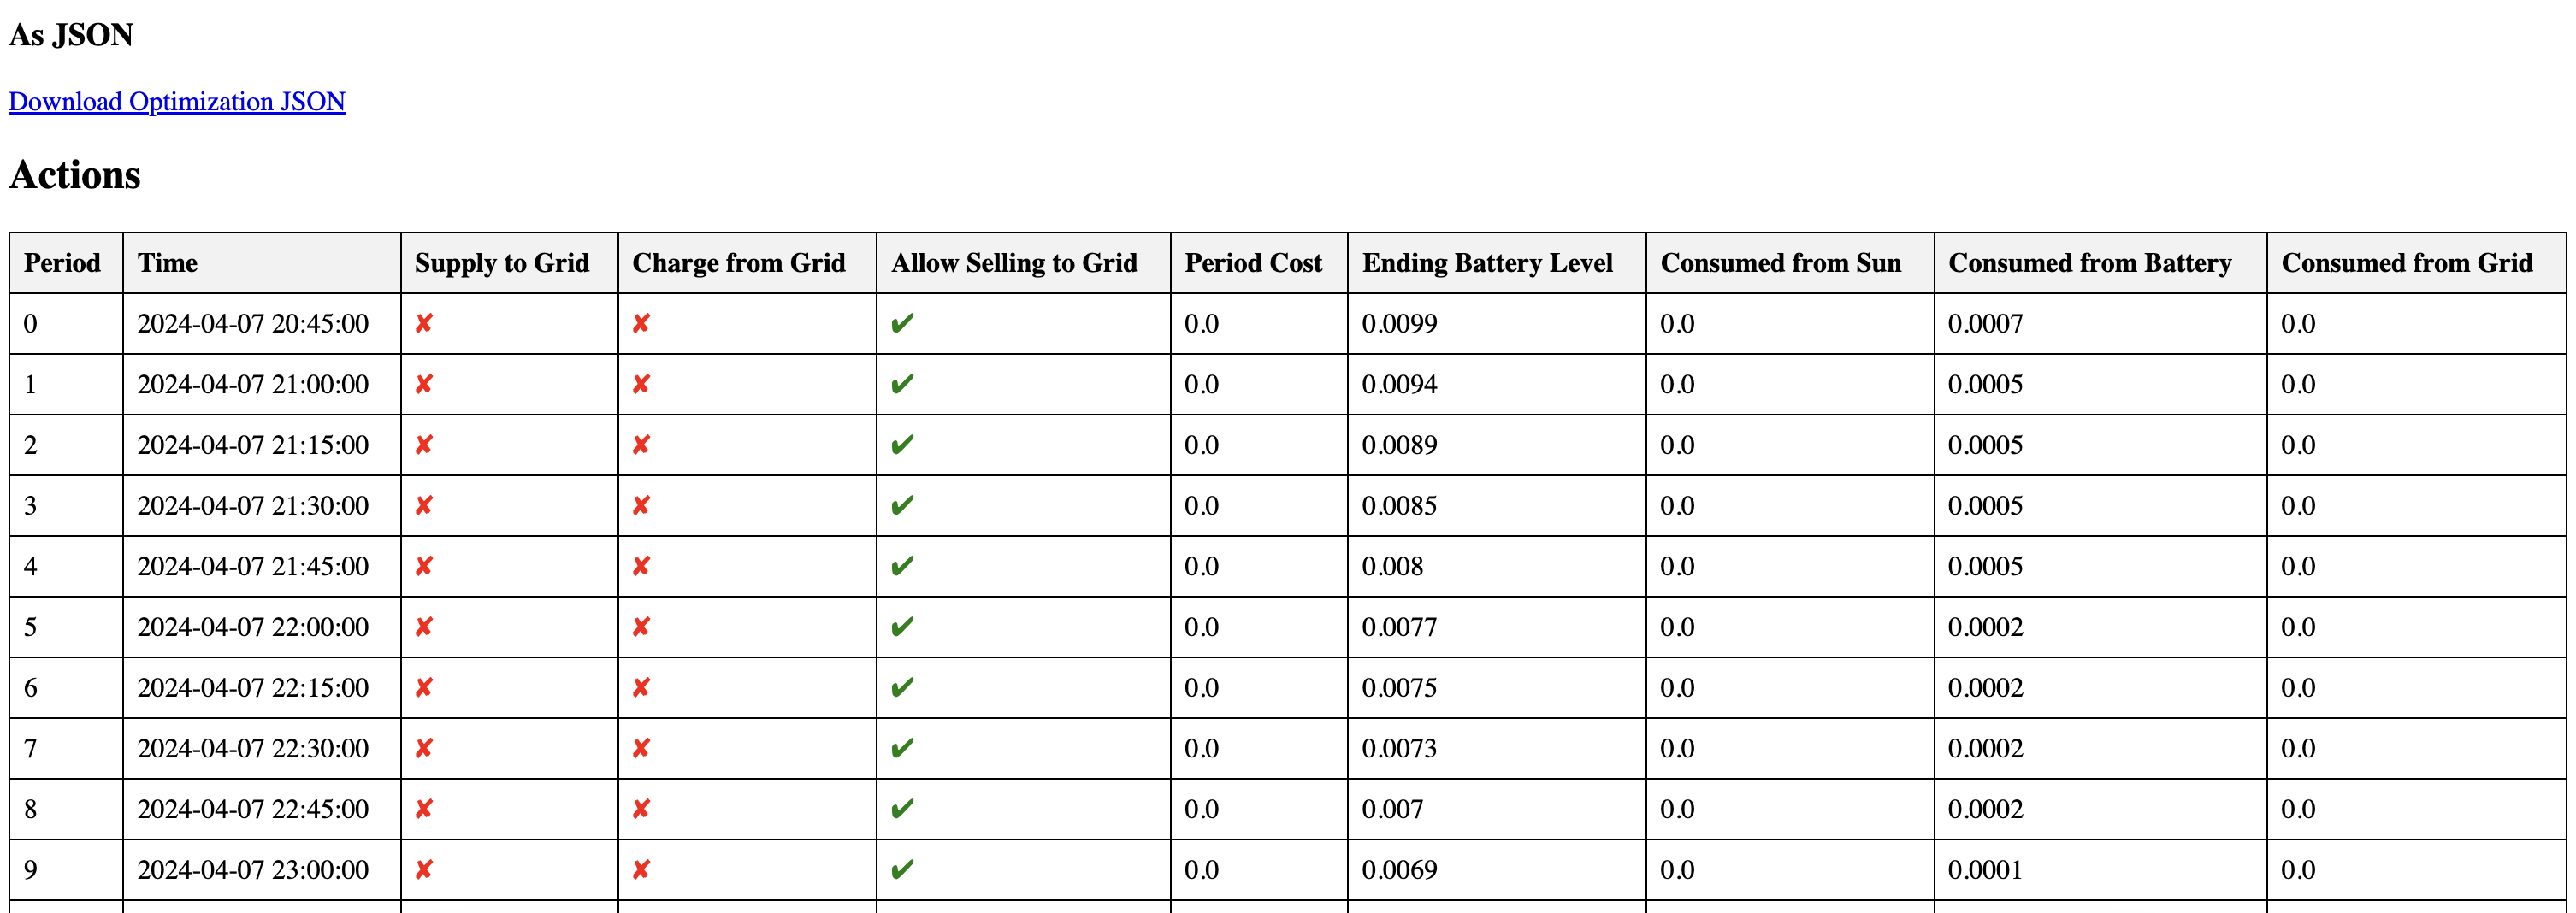
Optimization result
This details the results of an optimization run. It shows the predicted consumption, solar panel production, and the optimization results. We also added several charts.
Header with a part of optimization config
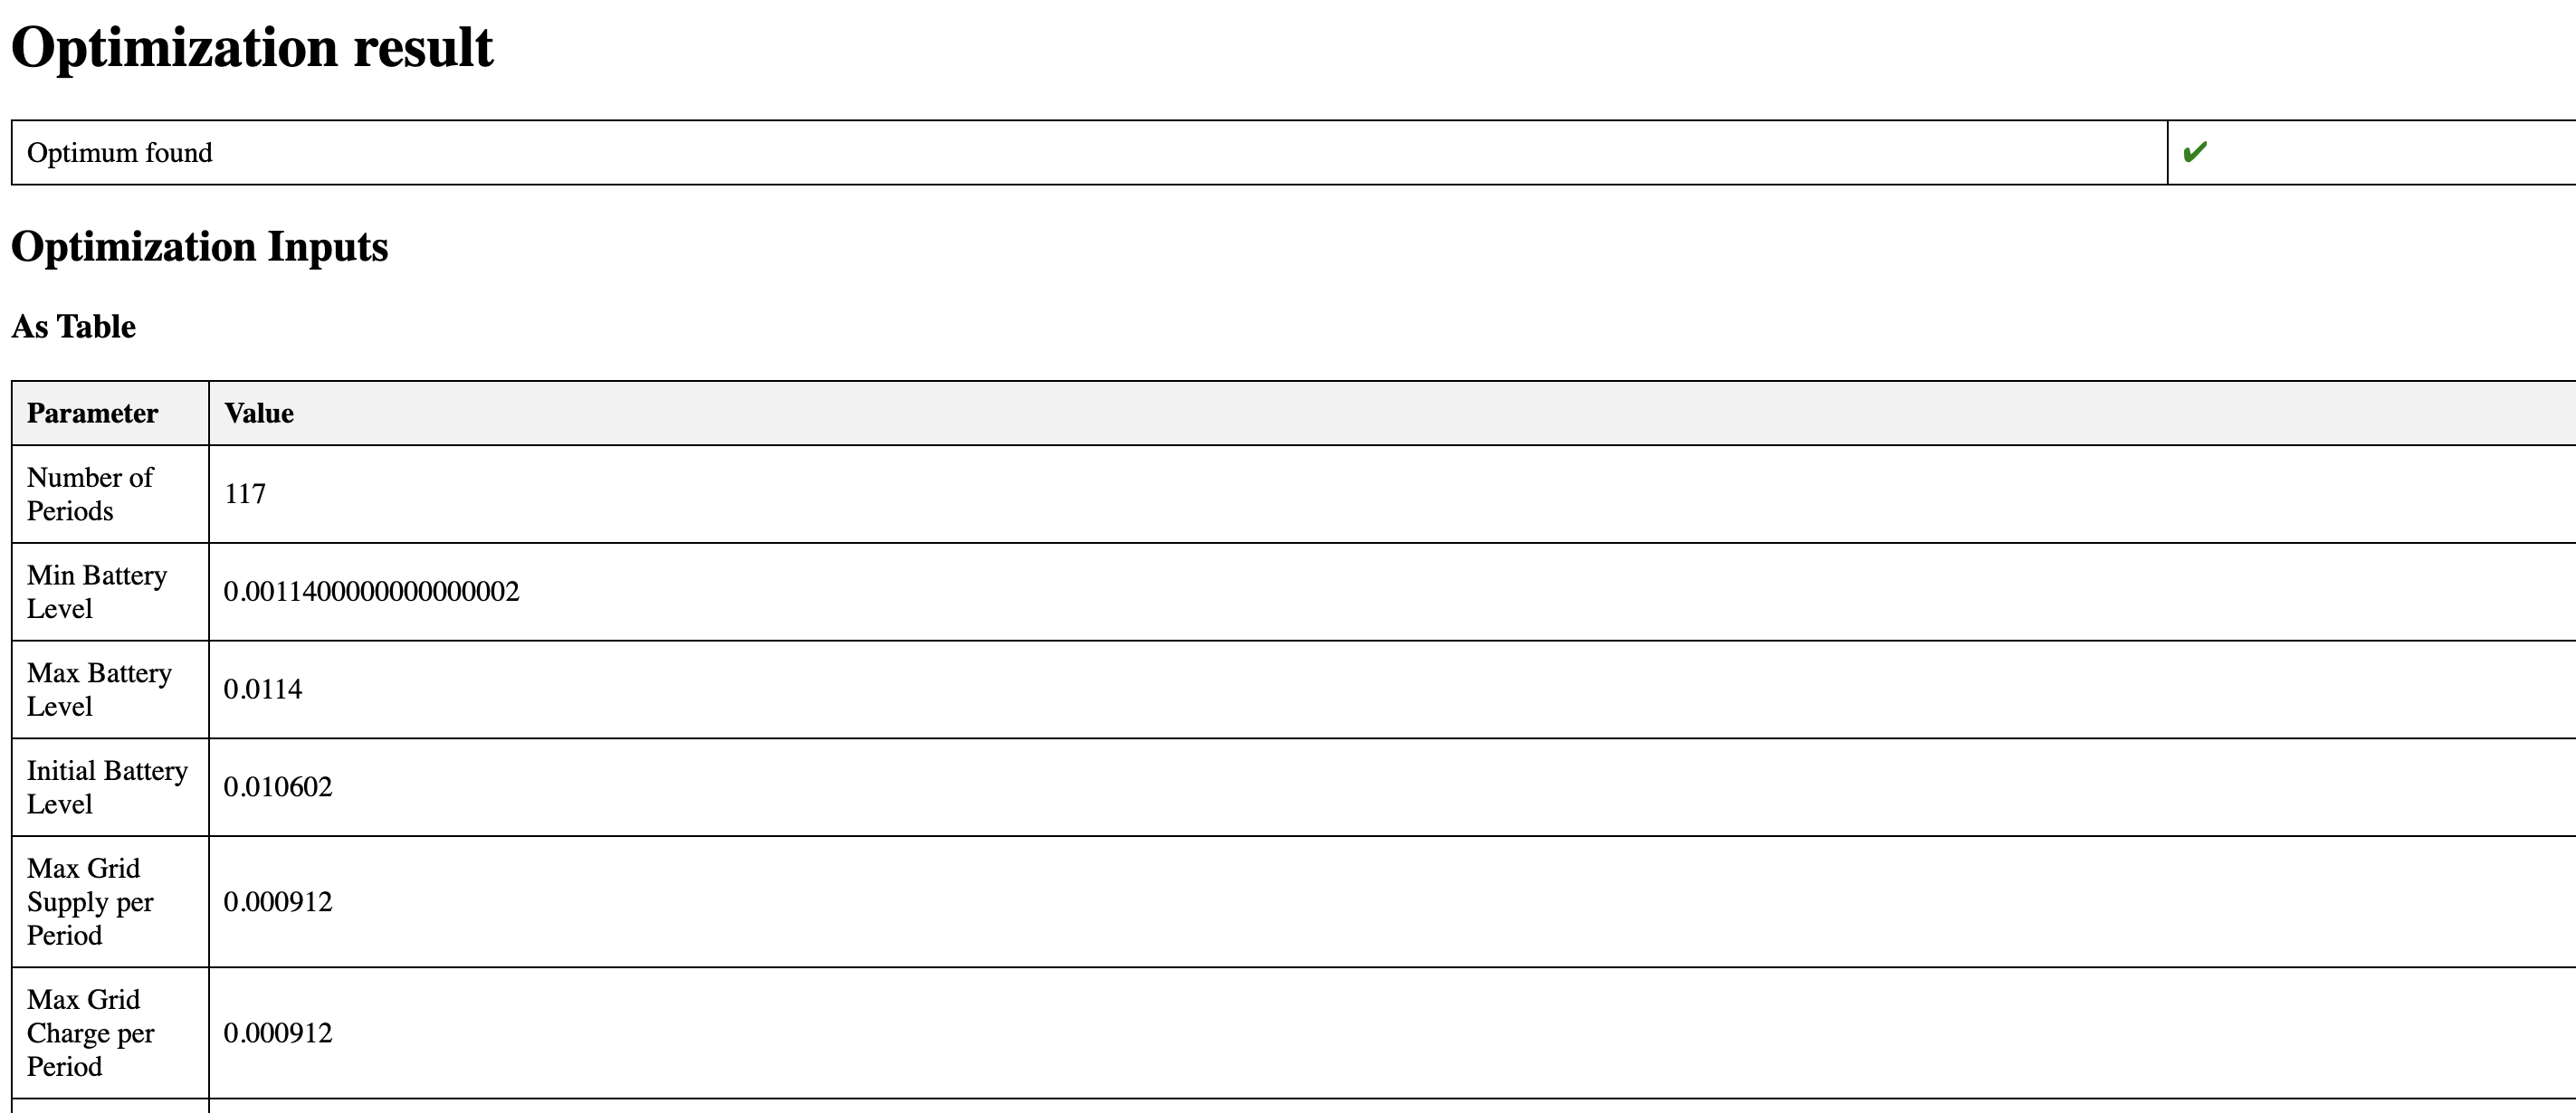
Example of optimization results
Battery level chart
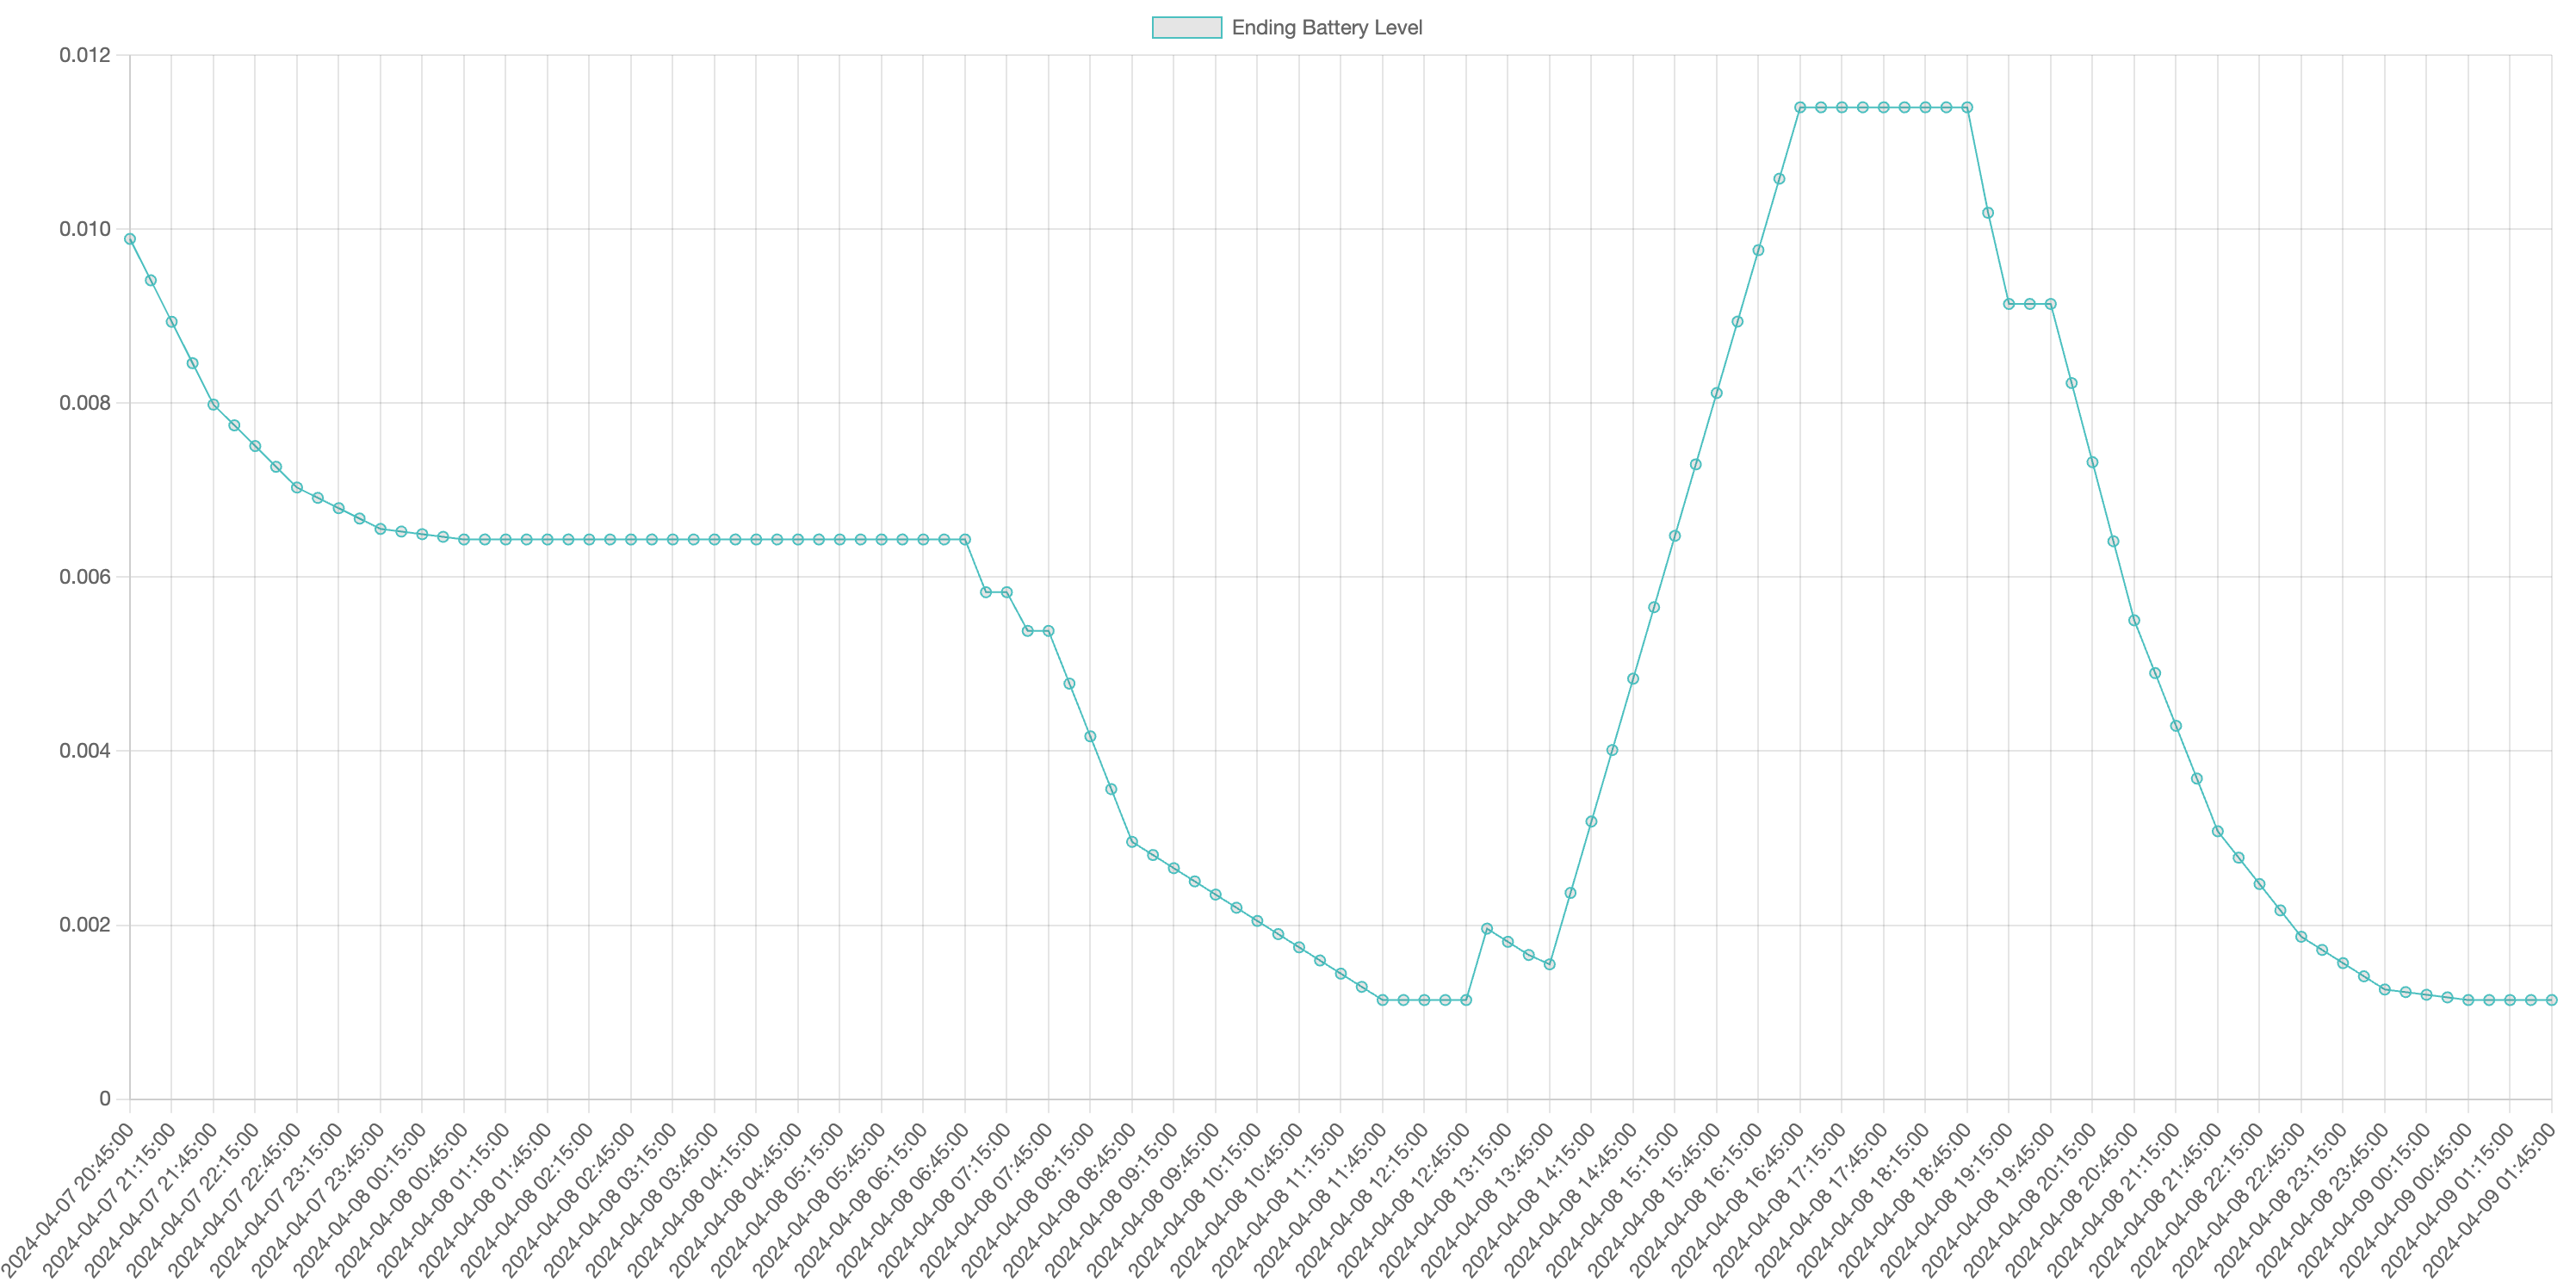
Ending battery level means battery level at the end of each 15-minute period.
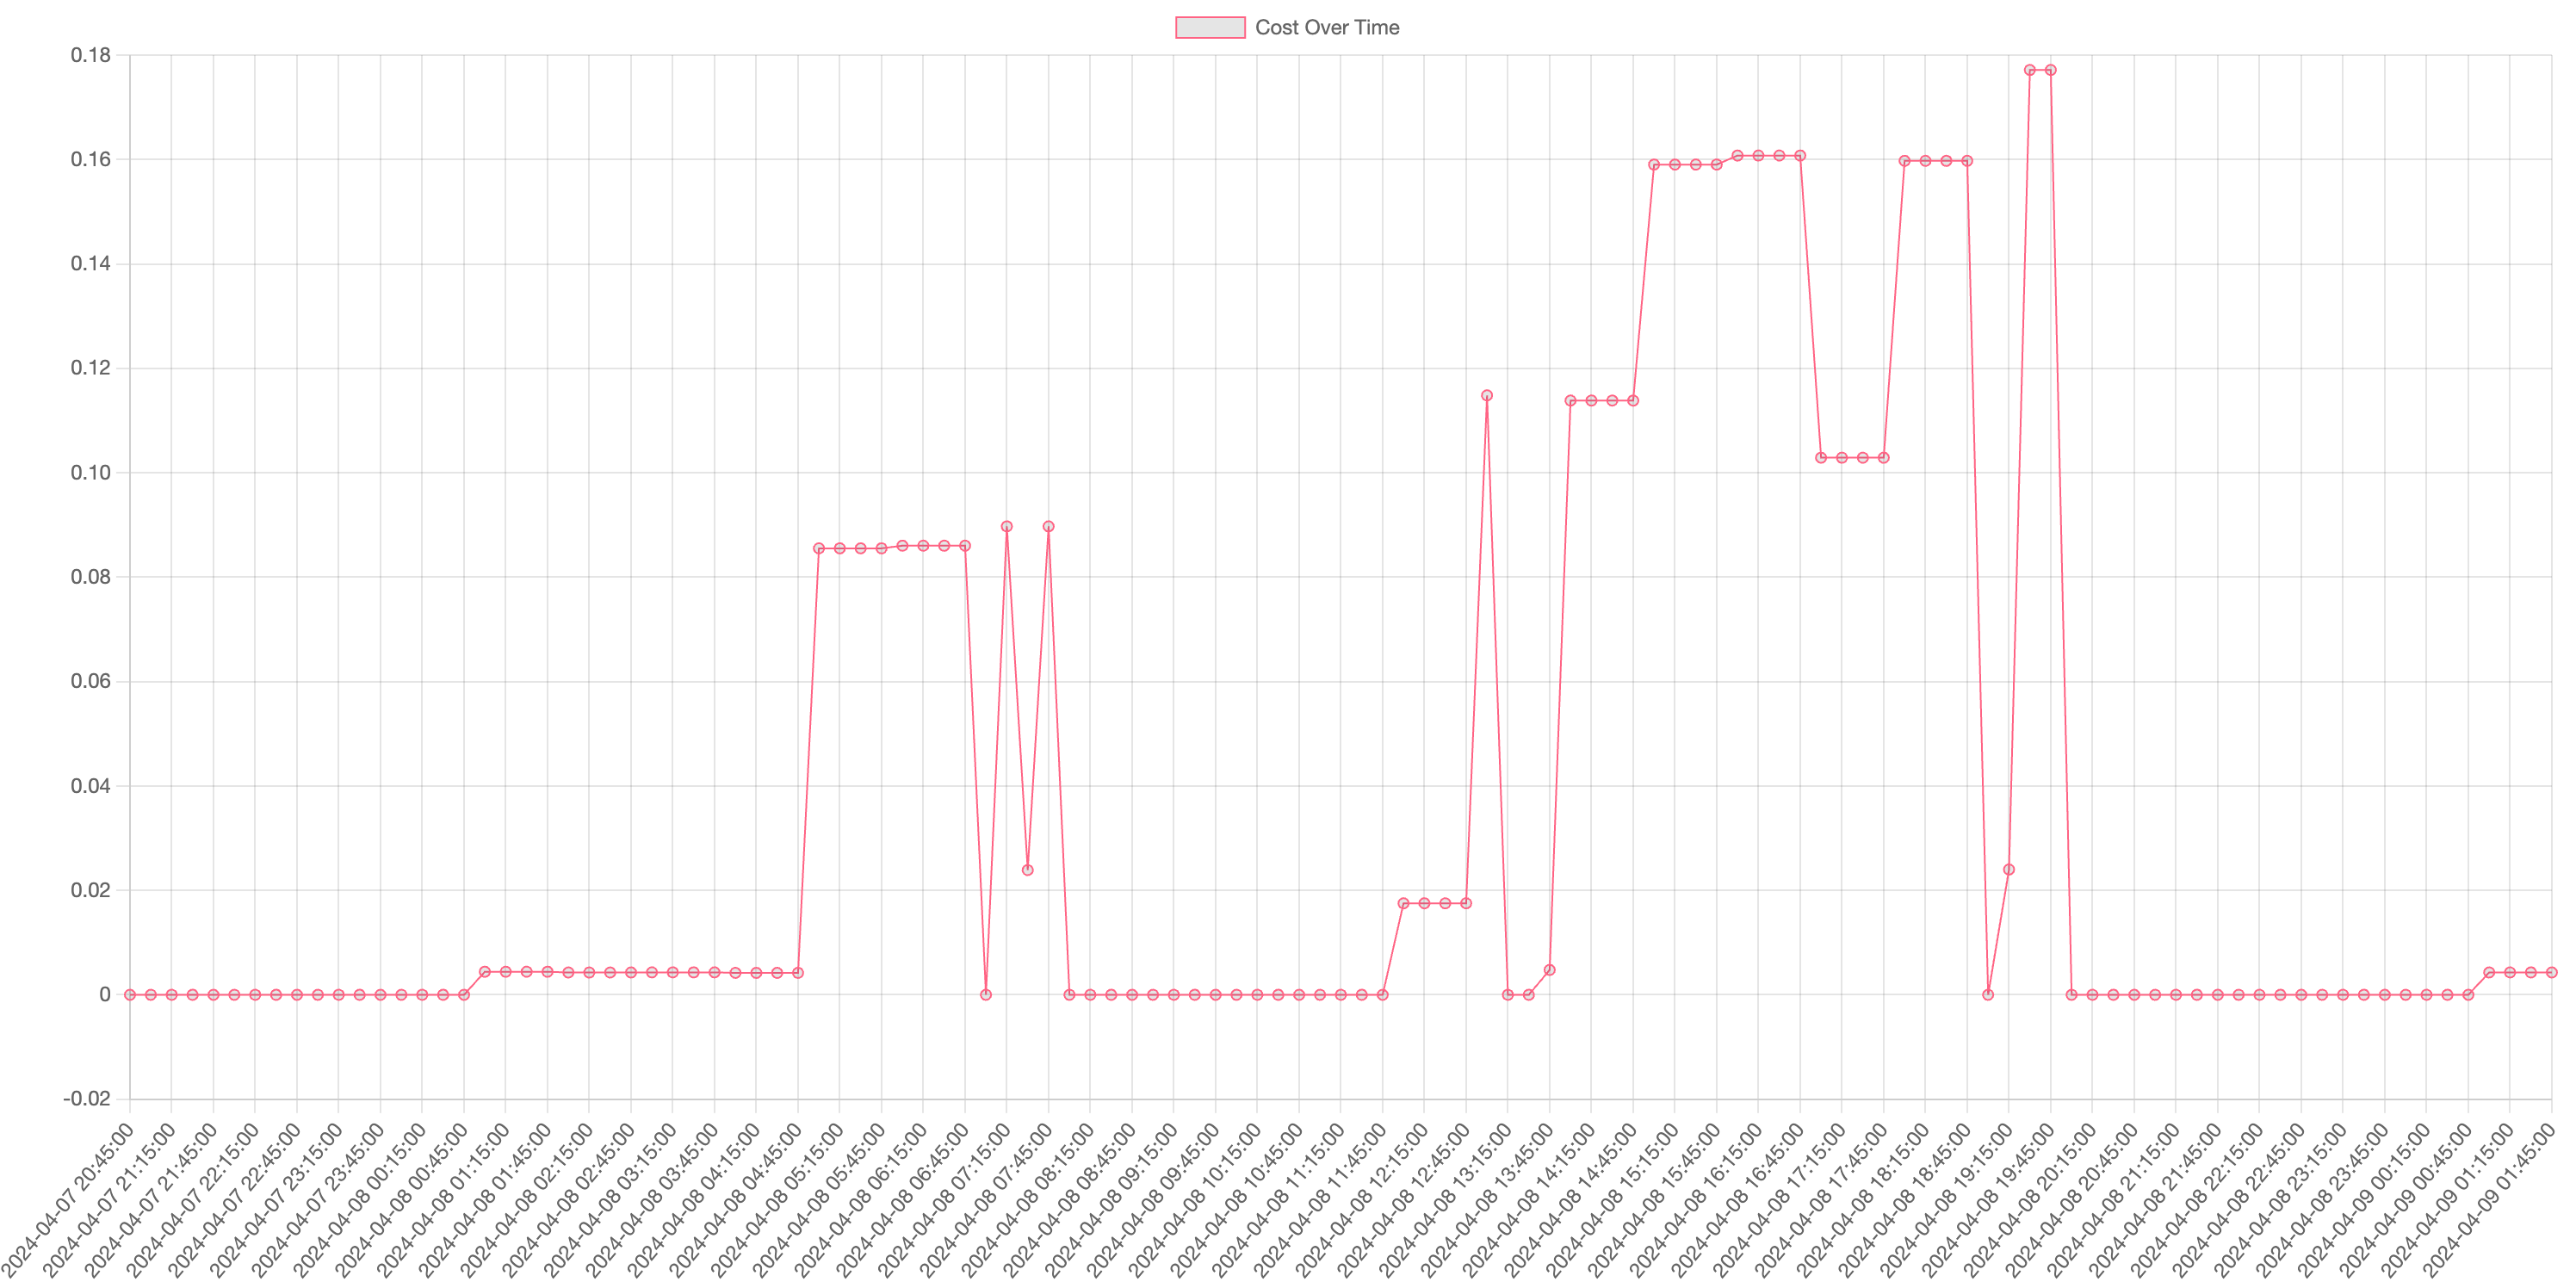
EUR cost chart
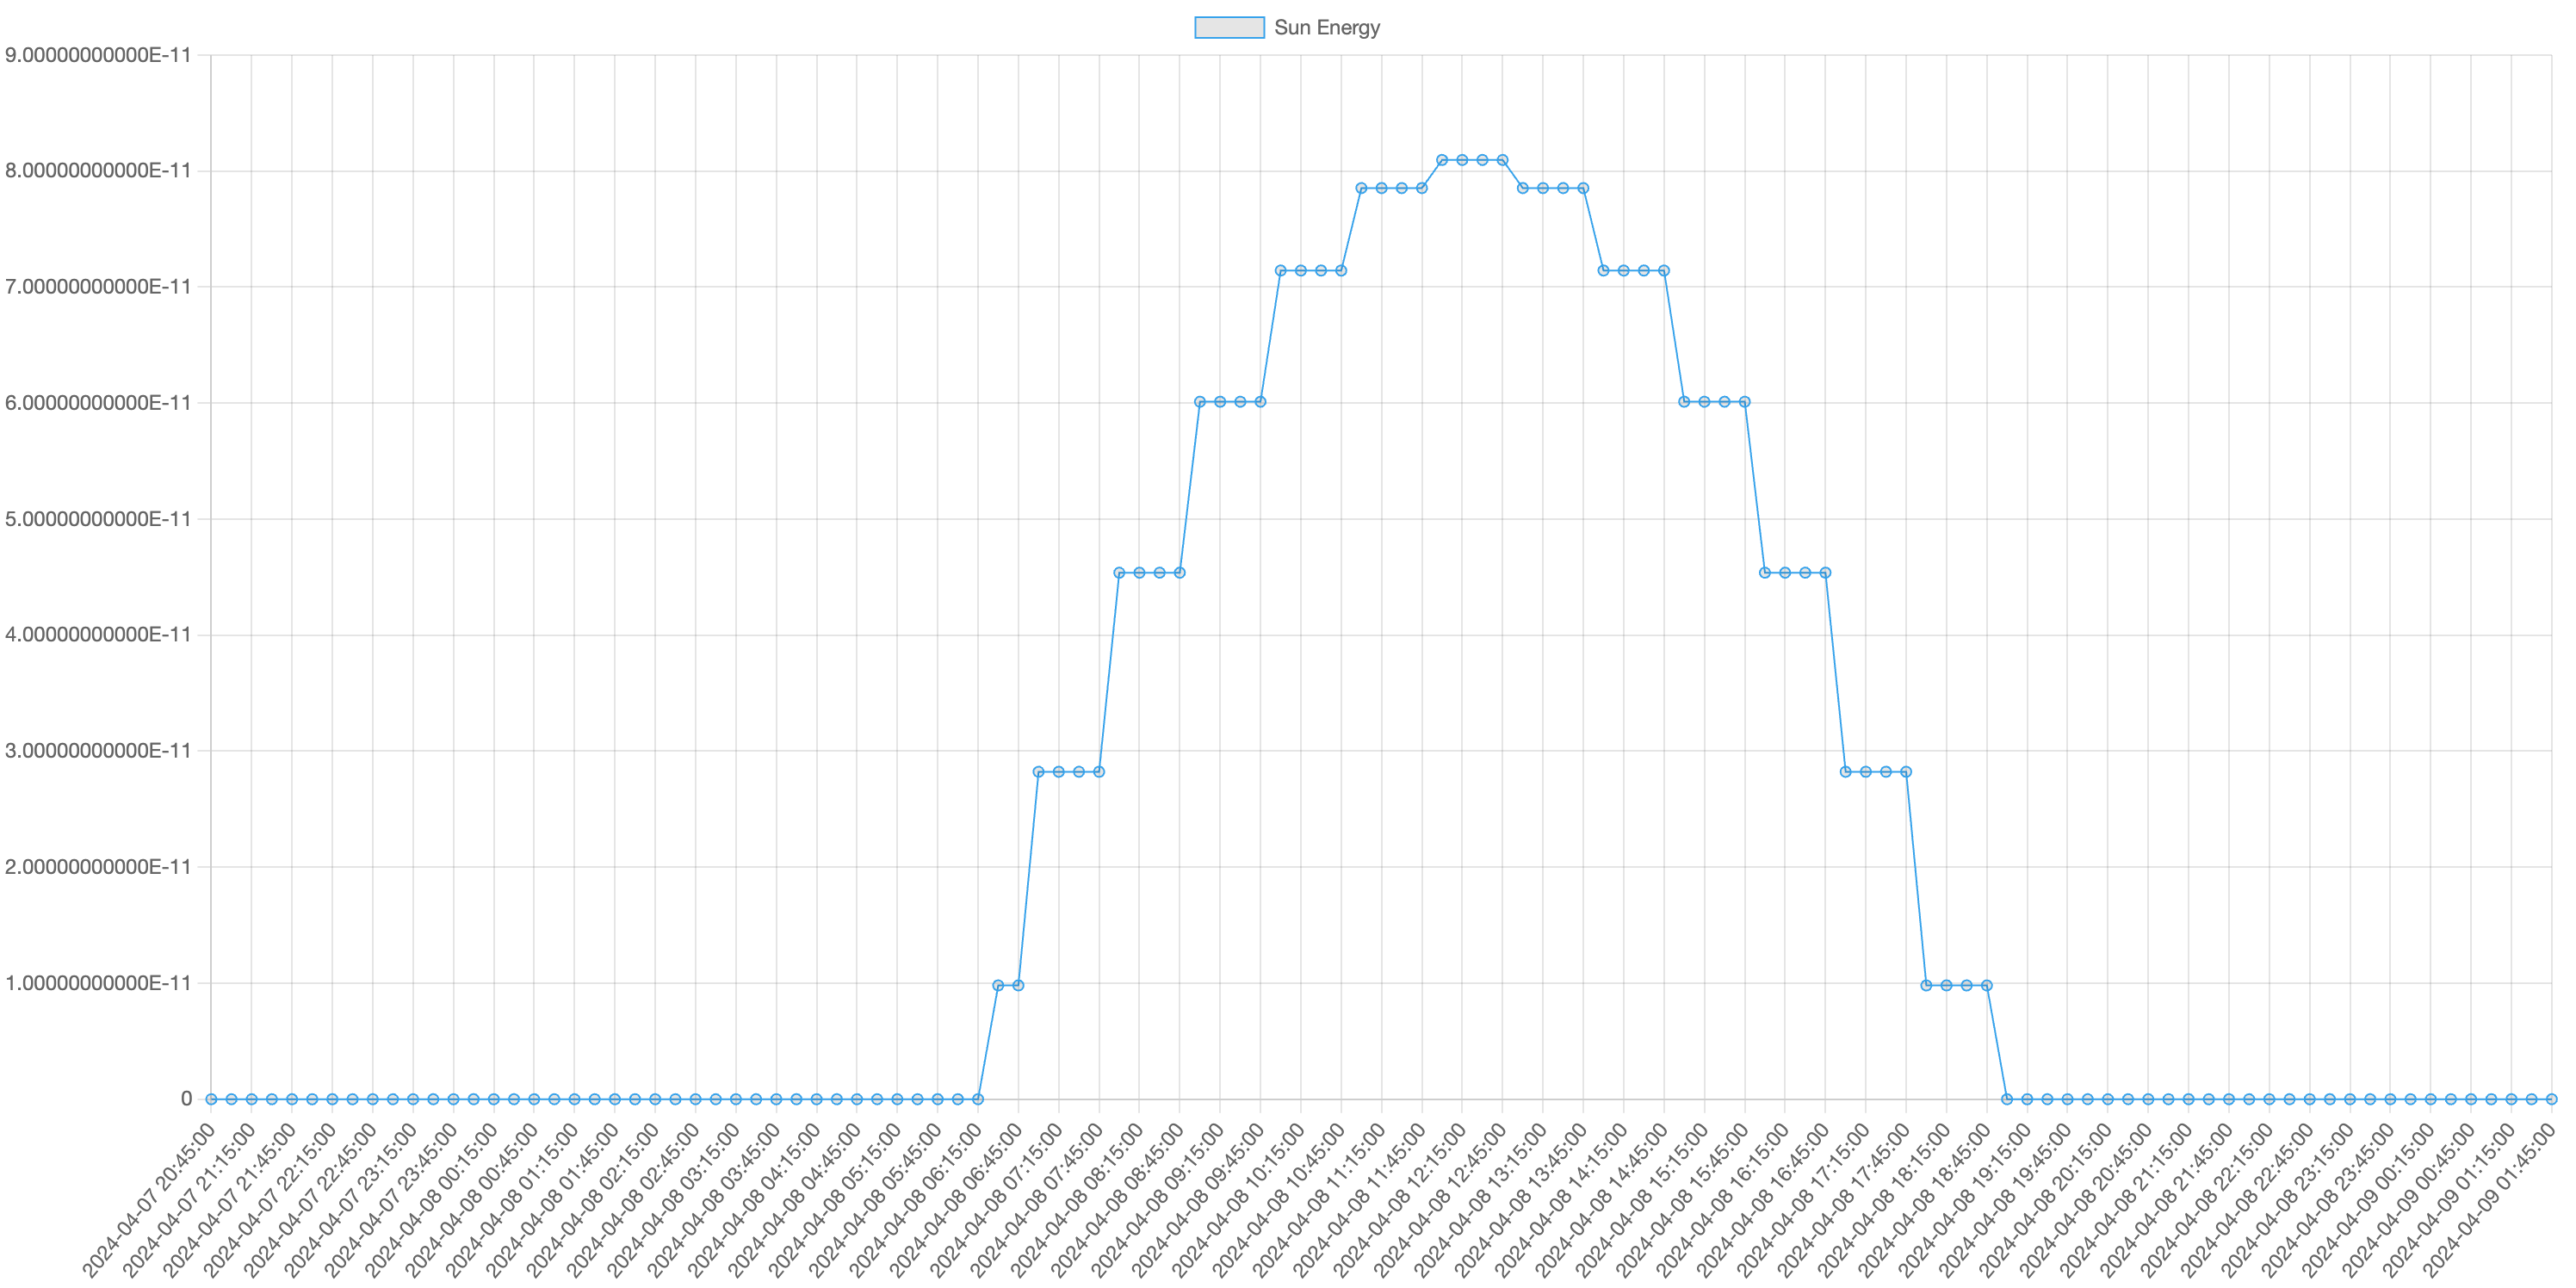
Electricity from the Sun
EUR buying and selling prices
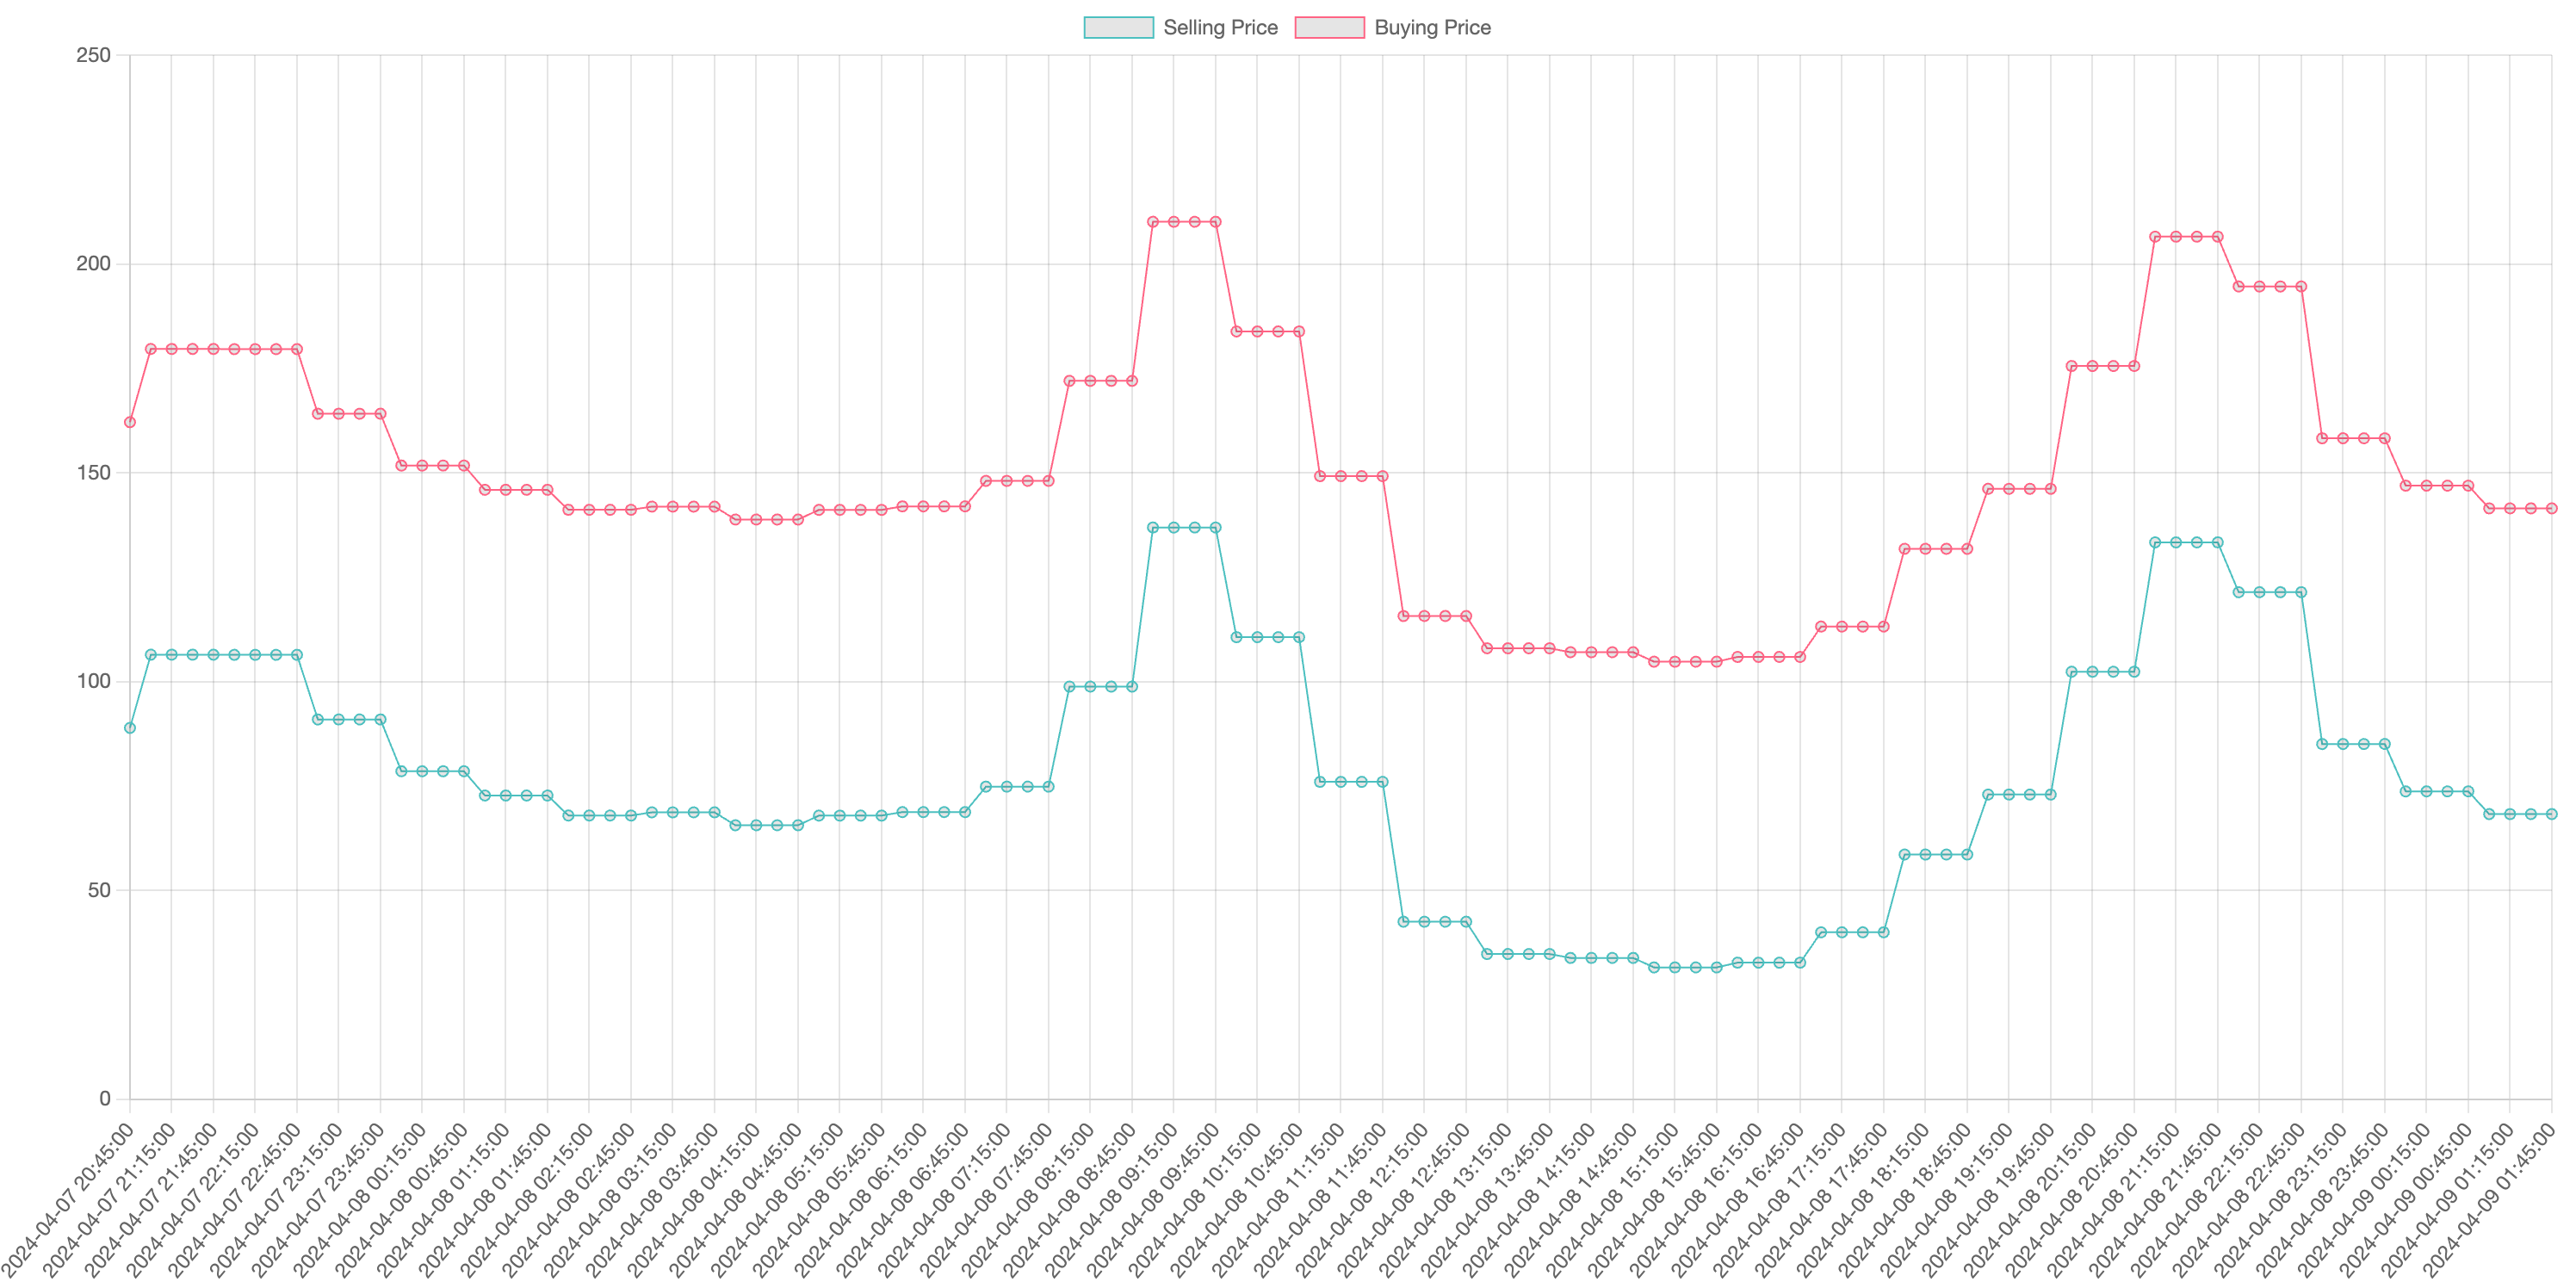 You can see that buying price is the selling price plus a constant.
Let’s describe the actual implementation in the next section.
Implementation & Technology
We created the HTML pages using Jinja templates. ChatGPT turned out to be super helpful for this. We often just supplied a Python dataclass, and it spat out a template for us. Apart from the occasional form header-field misalignment, it worked like a charm. Moreover, we generated most of Javascript code for charts by copy-pasting ChatGPT’s output.
Our server uses FastAPI. I prefer it over other Python frameworks as it has a neat way of solving data validation. Compared to Flask, FastAPI feels more opinionated. So you don’t have to sort through 10 ways of doing something when you are prototyping.
Since there is now a lot more data manipulation, the application needs a proper database. We went for SQLite. It runs in-process, so it is easy to set up and use. We don’t need to worry about managing a database server, and we can back up the data easily.
To keep things simple, we use a FastAPI extension for scheduling cron jobs. Hence, everything runs within the app.
Optimization selects values for the switches for all 15-minute periods that we have data for. We use 15-minute intervals to avoid overloading the power plant manufacturer’s API with too many requests.
The optimization runs in every period to account for the latest available data.
Although, the whole application is still in its infancy, we do have some monitoring. We write logs to a file, and we have a Sentry webhook set up to notify us of any errors.
The server’s docker container runs on our tiny VPC instance. Originally, we wanted to make it accessible from whitelisted IPs. We soon learned that managing the whitelist is a pain. Instead, we implemented a password authentication with Oauth2. It was a bit more work but it is more secure and user-friendly. The FastAPI documentation includes a tutorial on how to do it, and we were able to follow it almost verbatim.
We wrote bash scripts for deploying the app, building the docker image, and running it.
As with the previous iteration, there are still no tests.
What’s next
We have come a long way since starting this series. We have an automated solution that does something useful. Non-programmers can inspect it and control it.
There is a ton of things that we can improve. To give you a taste:
- Our approximation of consumption throughout the day seems to be off.
- Scheduling consumption turns out to be one of the most efficient ways to save energy.
- Electricity selling prices have been low recently. We might want to look for alternative ways to use the excess production.
Stay tuned for the next update!